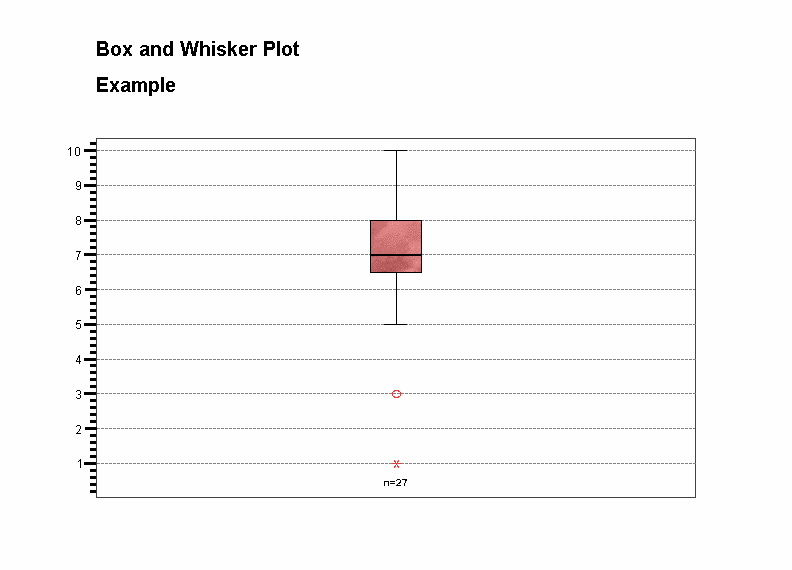
The boxplot gives a vertical view of the data. A boxplot plots the 25th percentile, the median (the 50th percentile), the 75th percentile, and outlying or extreme values.
The
boundaries
of the box
indicates the 25th percentile and the 75th percentile.
Variablility
The
length of the box represents the
difference between the 25th and 75th percentiles.
From the length of the box, you can determine the variability. The larger the box, the greater the spread of the data.
Central
Tendency
The horizontal line inside the box represents the median.
If the median is not in the center of the box, the distribution is skewed.
Whiskers
Whiskers: Draw lines from the ends of the box to the largest and smallest values that are not outliers. These lines are called whiskers. If the upper whisker is much longer than the lower whisker, it gives the impression of positive skewness.Identify Outliers
Outliers and Extremes. Symbols are used to label outliers (o) and extremes (*). The boxplot shown above detected outliers and extremes. The outliers are cases with the values between 1.5 and 3 box-lengths from the 75th percentile or 25th percentile. The extreme values are cases with the values more than 3 box-lengths from the 75th percentile or 25th percentile.